Configure and Use sFlow Visualization Tools
This article introduces you to monitoring and walks you through configuration of several sFlow visualization tools. You need a Linux-based host to install the collectors below. You can read more about setting up sFlow on your Cumulus Linux switch in the user guide.
Understanding Monitoring
Monitoring can provide important insight into your network. Many tools, both open source and commercial, exist to help you monitor the traffic flowing through your network as well as the performance of your switches and routers. Cumulus Linux, in versions 2.1 and up, supports the Host sFlow protocol. Host sFlow can sample traffic going through your network as well as metrics and counters on the switches, to give a holistic view of your network. A variety of network gear and system operating systems also support sFlow.
The two important pieces to successfully setting up sFlow are:
- Setting up the hosts
- Setting up the collectors
NVIDIA strongly recommends using a separate server for your sFlow collector, as switches running Cumulus Linux are specialized and do not have the storage and CPU to satisfactorily perform as a collector. You can read about how to set up your Cumulus Linux switch to be a collector in the user guide. The documentation from your server vendor describes configuring your server to be an sFlow collector, while this article describes some popular setups.
After your hsflow daemon starts sending monitoring traffic to your collections server, you can find out some interesting data such as top talkers, interface status, and top flows.
Popular sFlow Tools
Many popular tools exist for sFlow data. You can find a comprehensive list here. With so many tools in the wild, choosing one might depend on your organization’s existing infrastructure and your goals. Because sFlow can send to multiple collectors, you do not need to limit yourself to one tool.
Two free, very simple open source collectors are Wireshark and sflowtool. They are useful for debugging a low bandwidth single flow or for ensuring that your hosts are properly configured and sending sFlow data, but they are not very human readable.
Due to the high volume of traffic passing through most switches, a more human readable format is often preferred. Graphs also provide excellent visibility.
Many organizations have existing systems to monitor servers. One of these, Ganglia, can directly ingest sFlow counter samples and display switch metrics directly. Graphite, another popular tool for visualizing system data, can display sFlow data with the sflow2graphite script.
Tools that specialize in network traffic also exist for sFlow. These tools can also ingest netflow data, for compatibility with any network gear which does not yet support sFlow. These tools also show more network specific information such as flow data. Two popular open source projects are pmacct and NfSen (described in more detail below).
Some popular commercial options are Traffic Sentinel (described in more detail below), Arbor Peakflow and Solarwinds NetFlow Traffic Analyzer.
NfSen
NfSen is one of the popular open source project which monitors networking data. There was an excellent guide to setting up NfSen, which is archived here. There are two or three caveats to this guide. Because you are using sFlow, when compiling nfdump, be sure to use the --enable-sflow flag. When you set up a source in nfsen.conf, it should look like the following:
%sources = (
    'upstream1'    => { 'port' => '6343', 'col' => '#0000ff', 'type' => 'sflow' },
);
Notice that the type flag is sflow, not netflow.
If you are installing NfSen on a Debian-based system (like Debian or Ubuntu), you need to add LSB tags to the init file. Edit /etc/init.d/nfsen, and after the line #!/usr/bin/perl, add:
### BEGIN INIT INFO
# Provides:          nfsen
# Required-Start:    $local_fs $network $syslog
# Required-Stop:     $local_fs $syslog
# Default-Start:     2 3 4 5
# Default-Stop:      0 1 6
# Short-Description: nfsen
# Description:       nfsen
### END INIT INFO
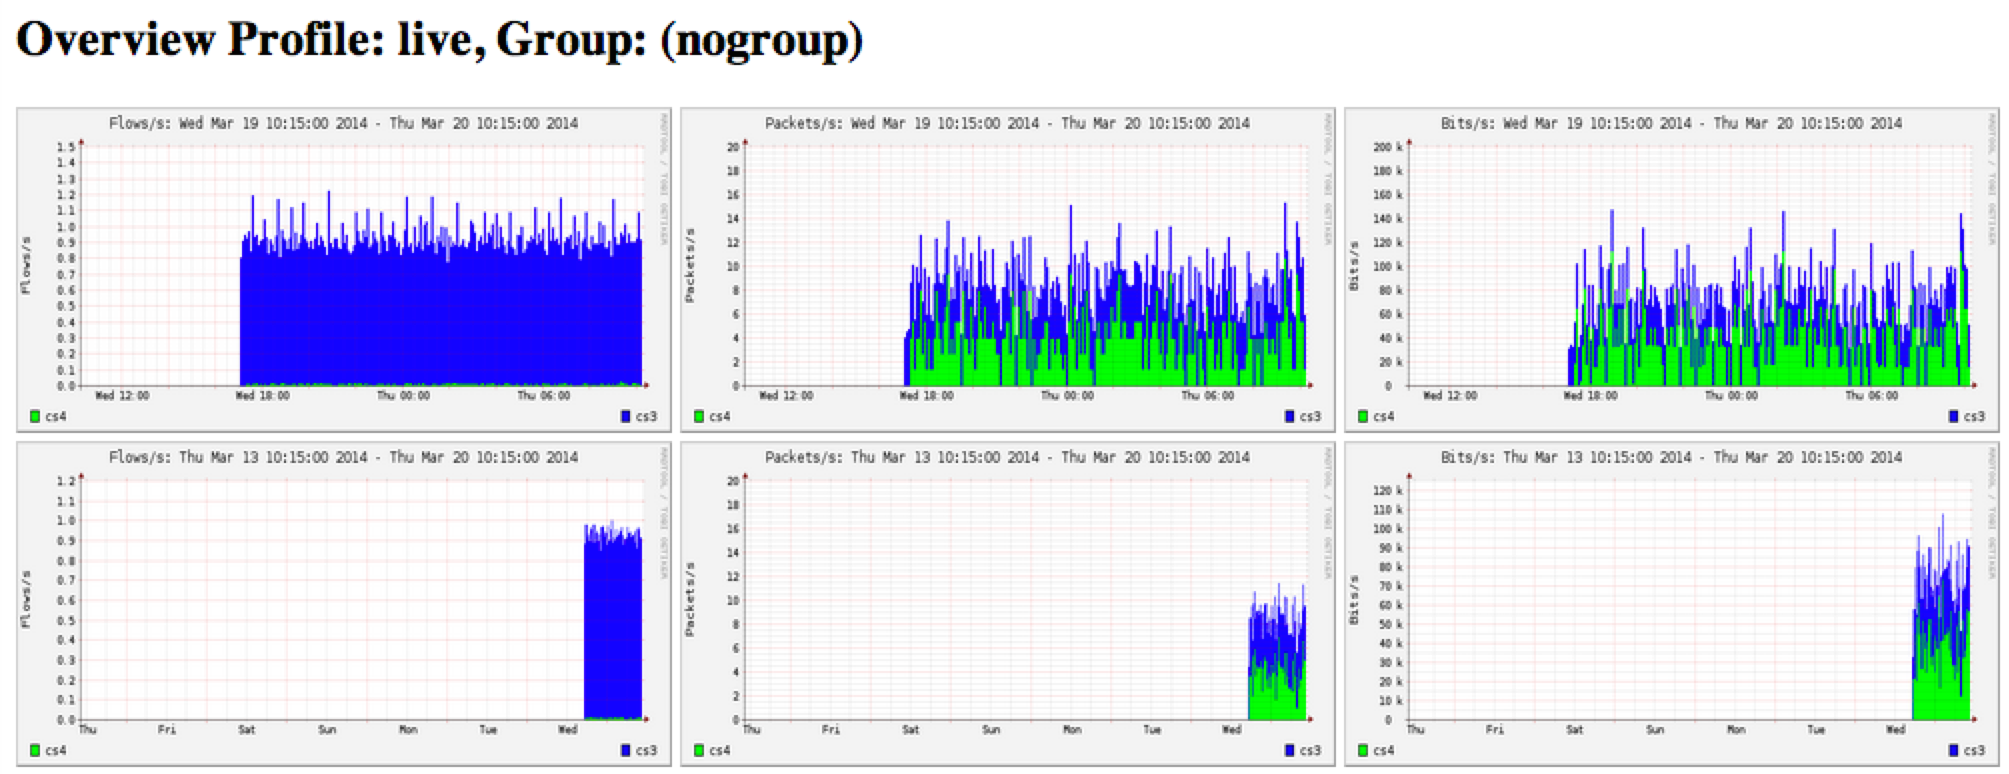
Sample NfSen Images
This is the NfSen dashboard, showing various network flows, packets/second, and bits/second.
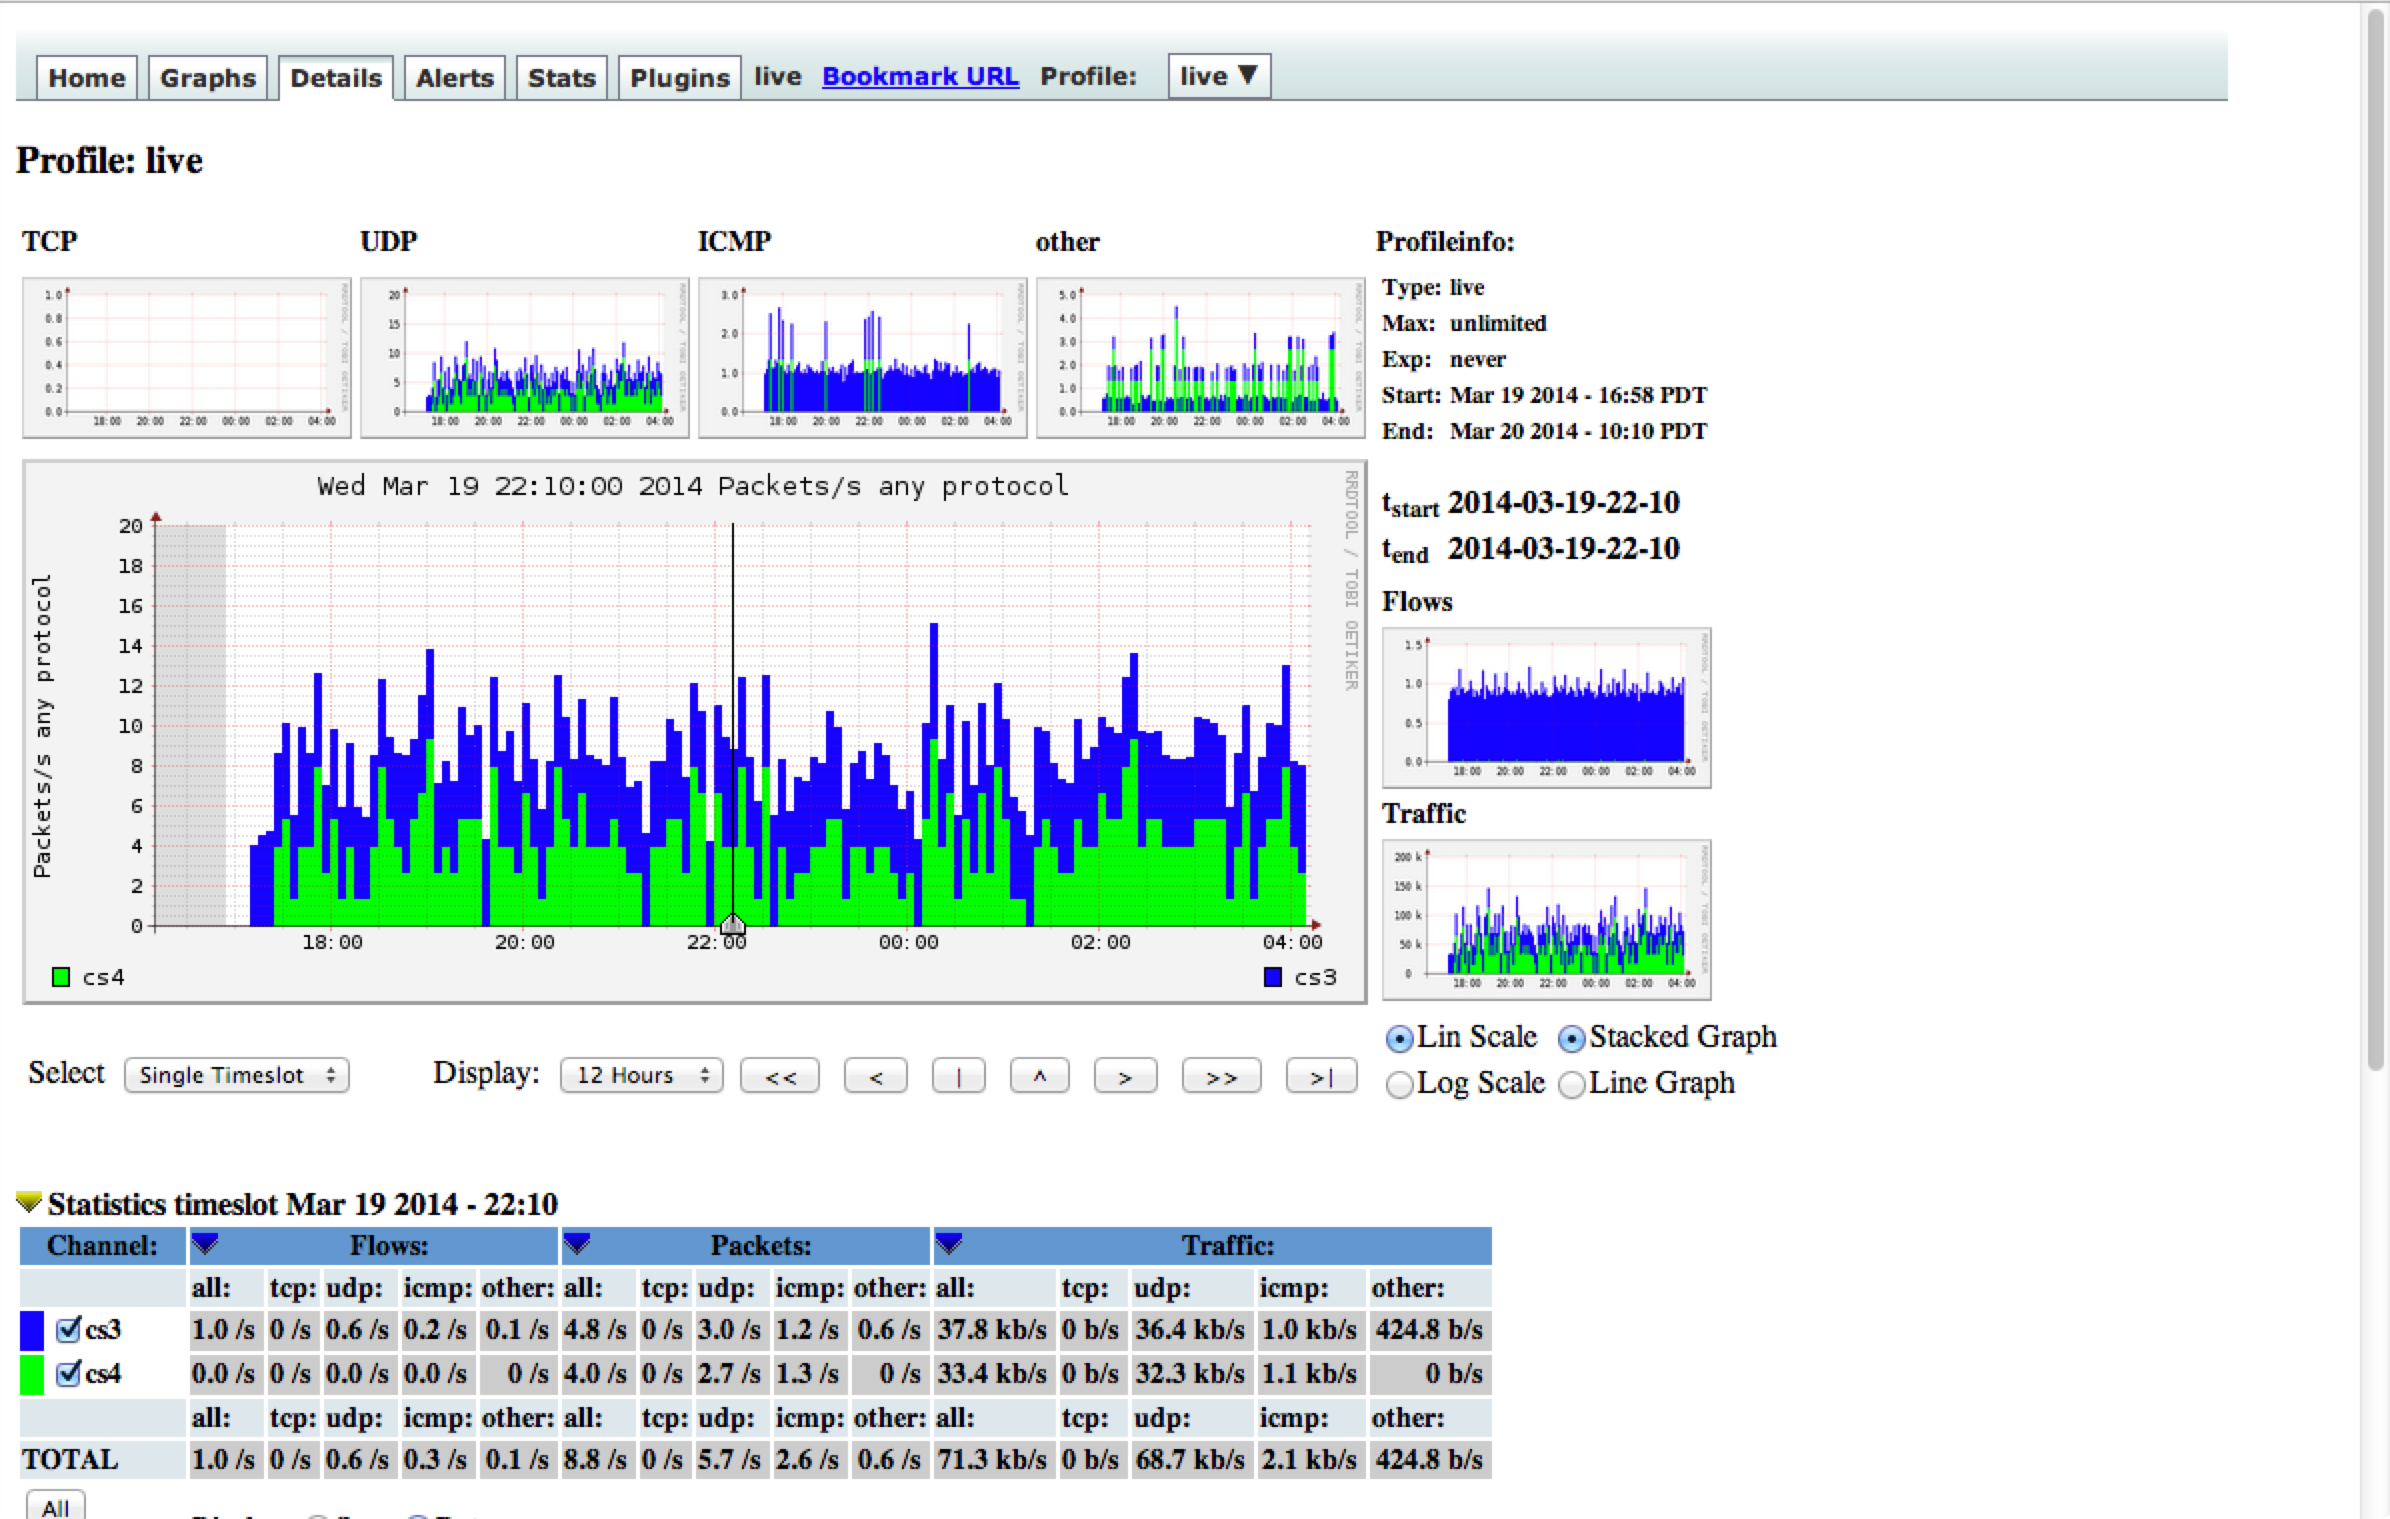
This image shows the largest flows:
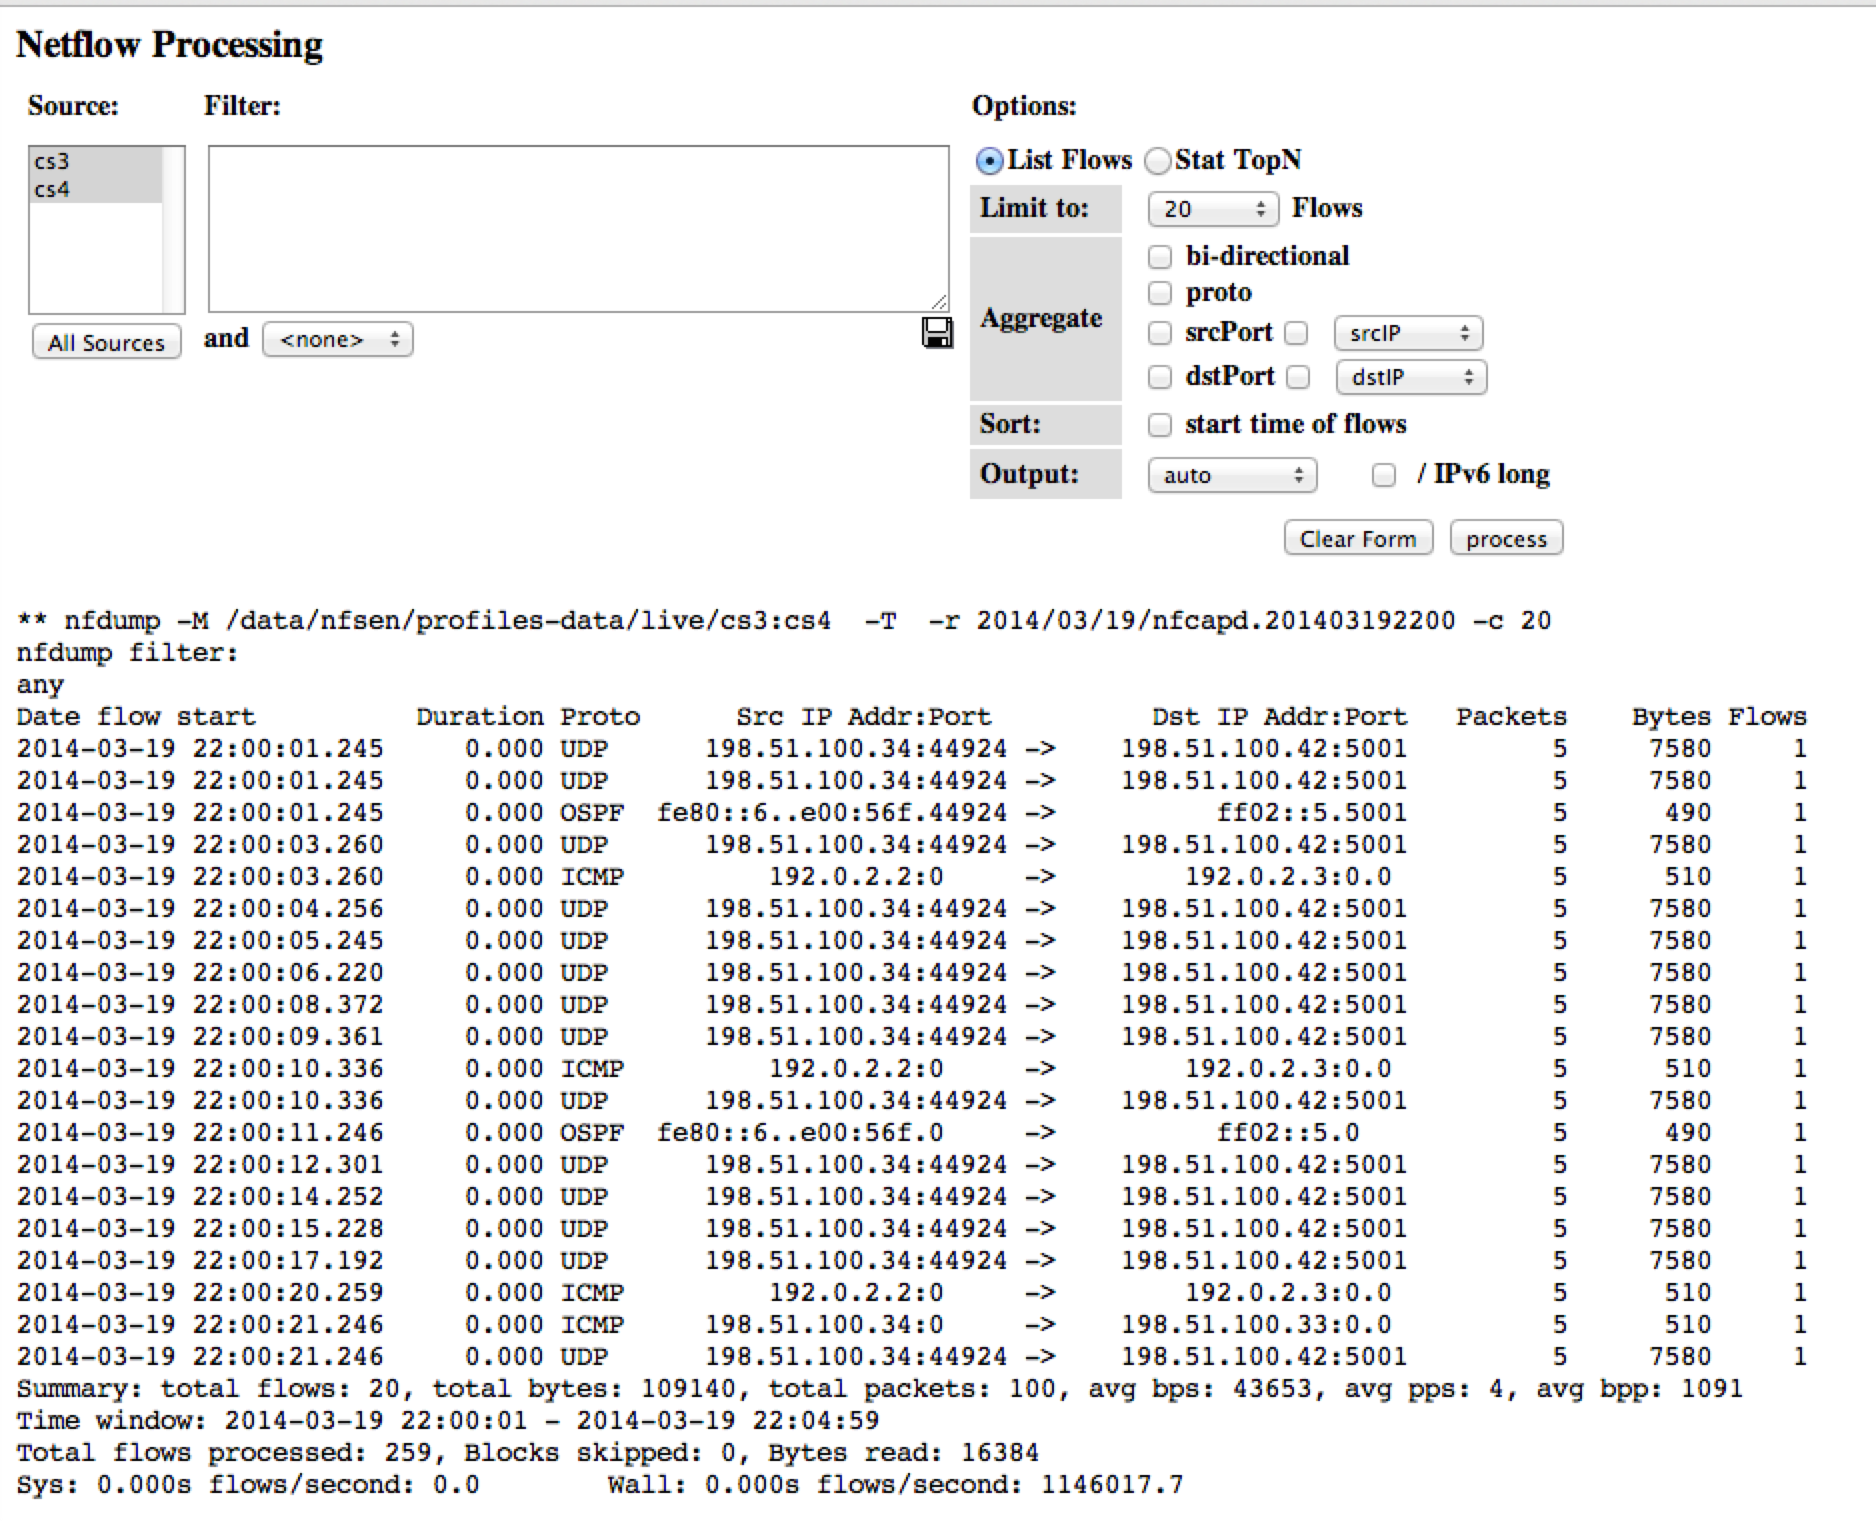
This image shows more details of a network flow:
Traffic Sentinel
Traffic Sentinel is a popular commercial project that bridges both server metrics and network data. This tool is useful so you can have all your monitoring in one location. Install the server on a Linux host using these instructions (you must register to access the instructions).
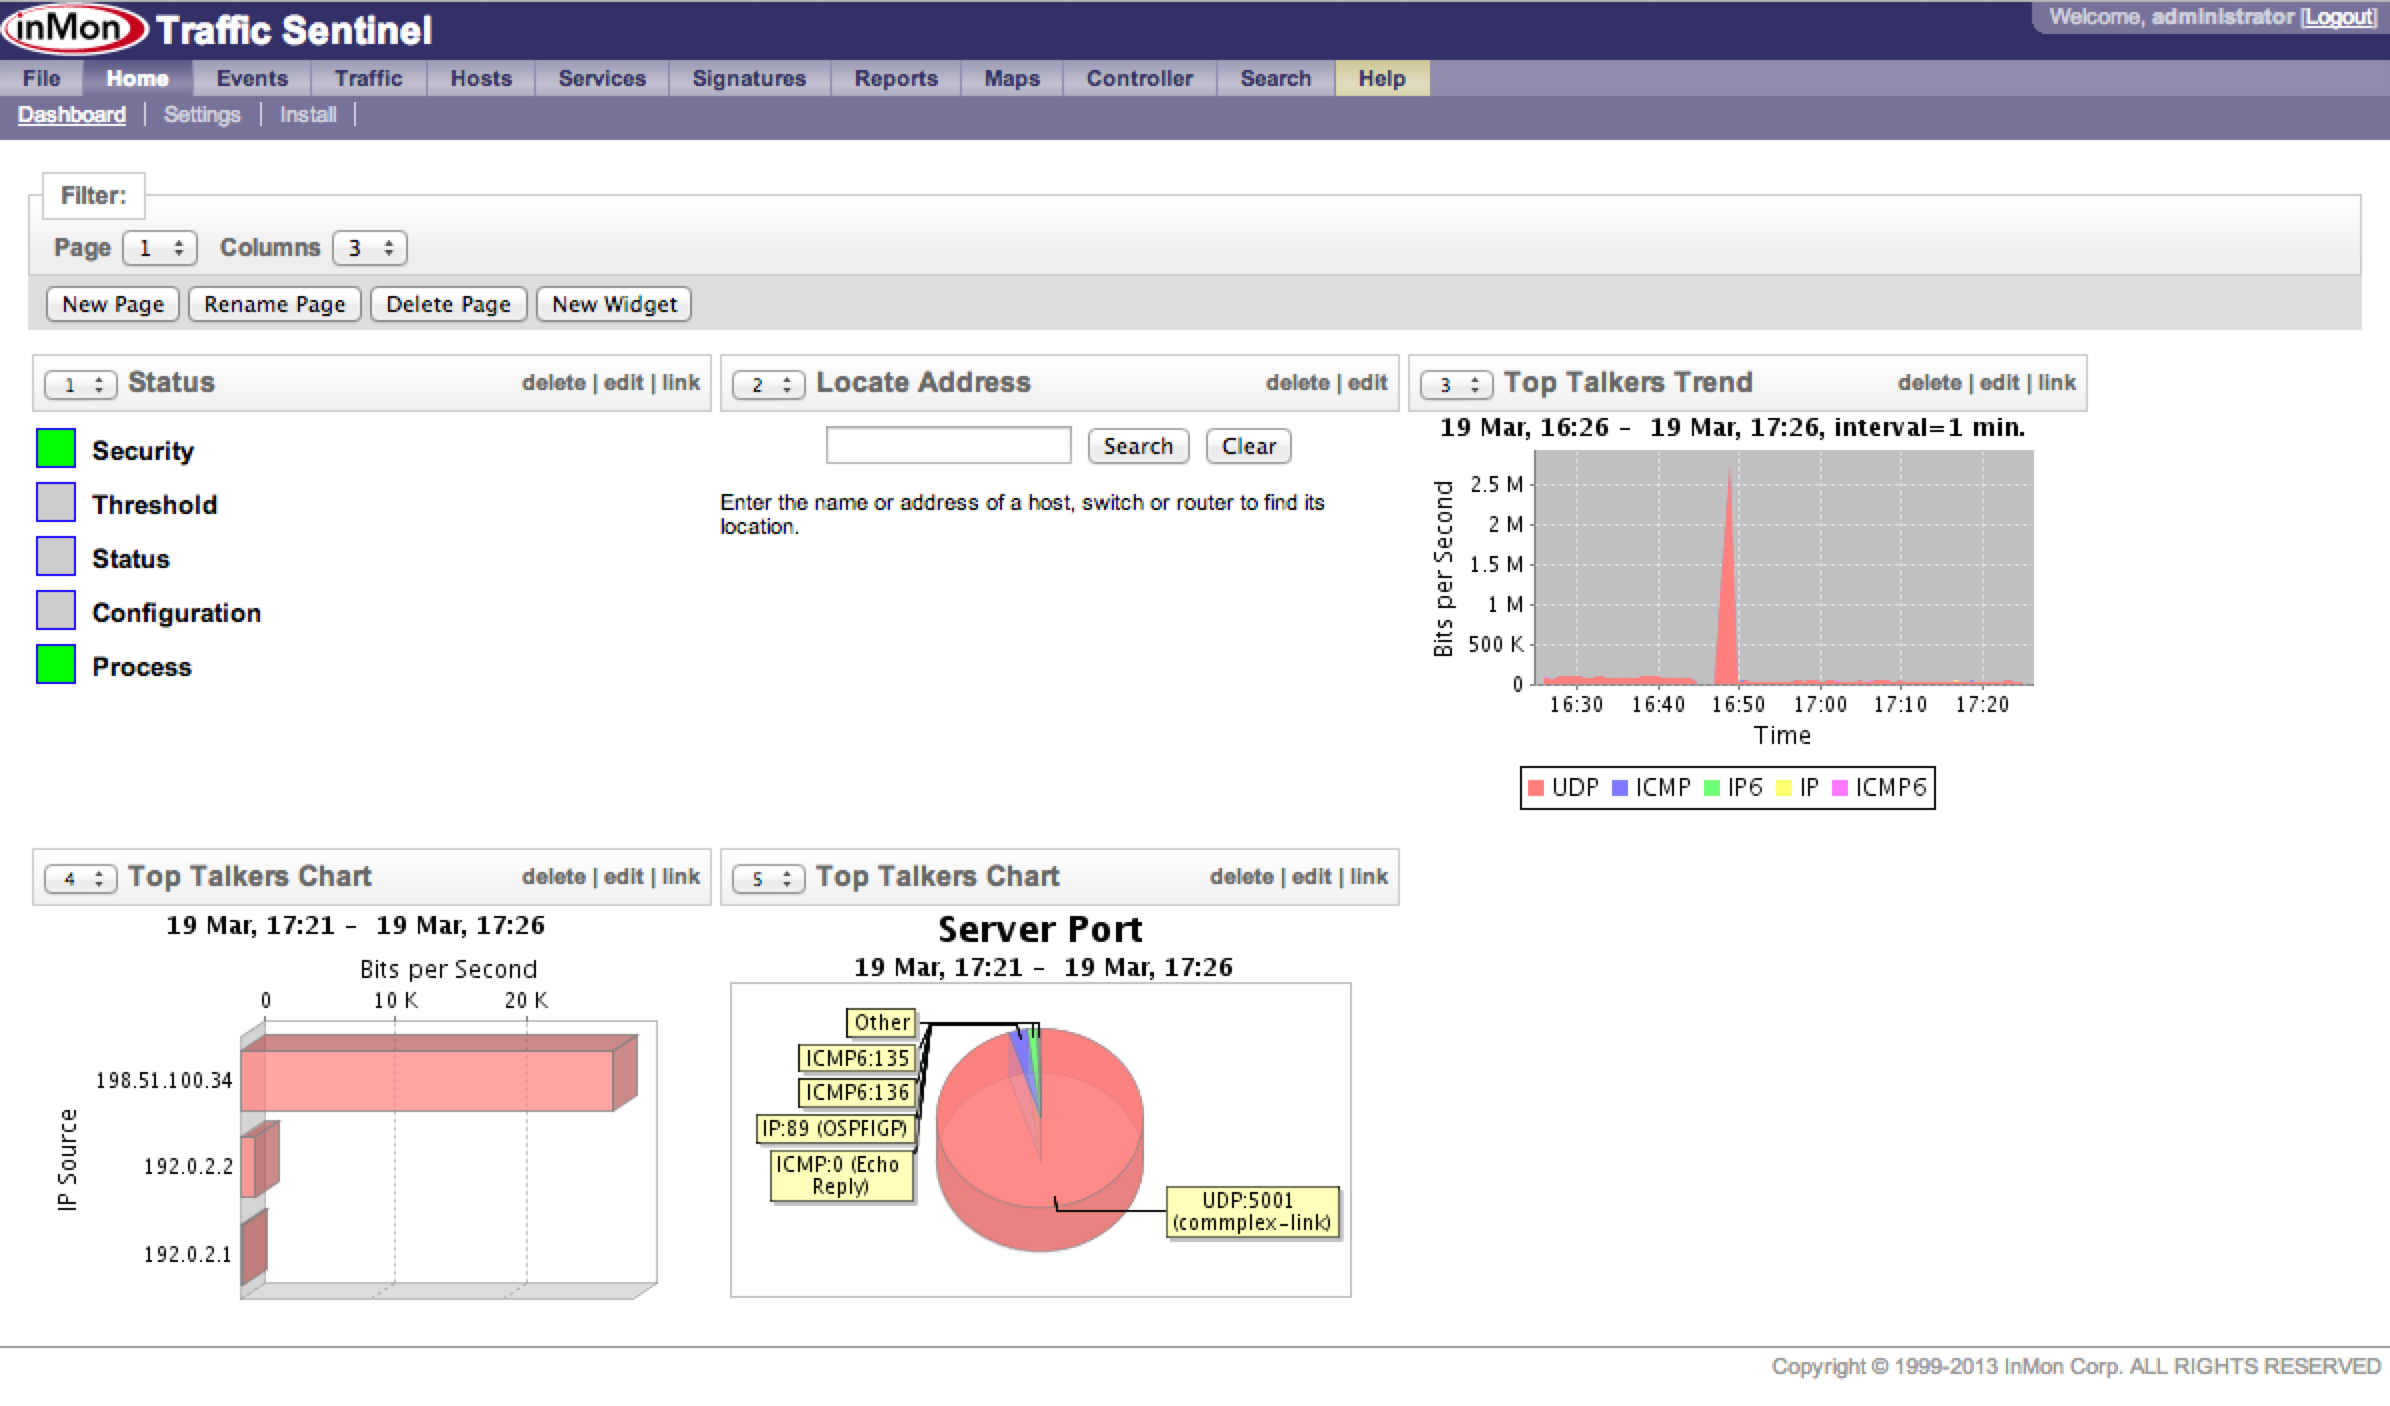
Sample Traffic Sentinel Images
This is the Traffic Sentinel dashboard:
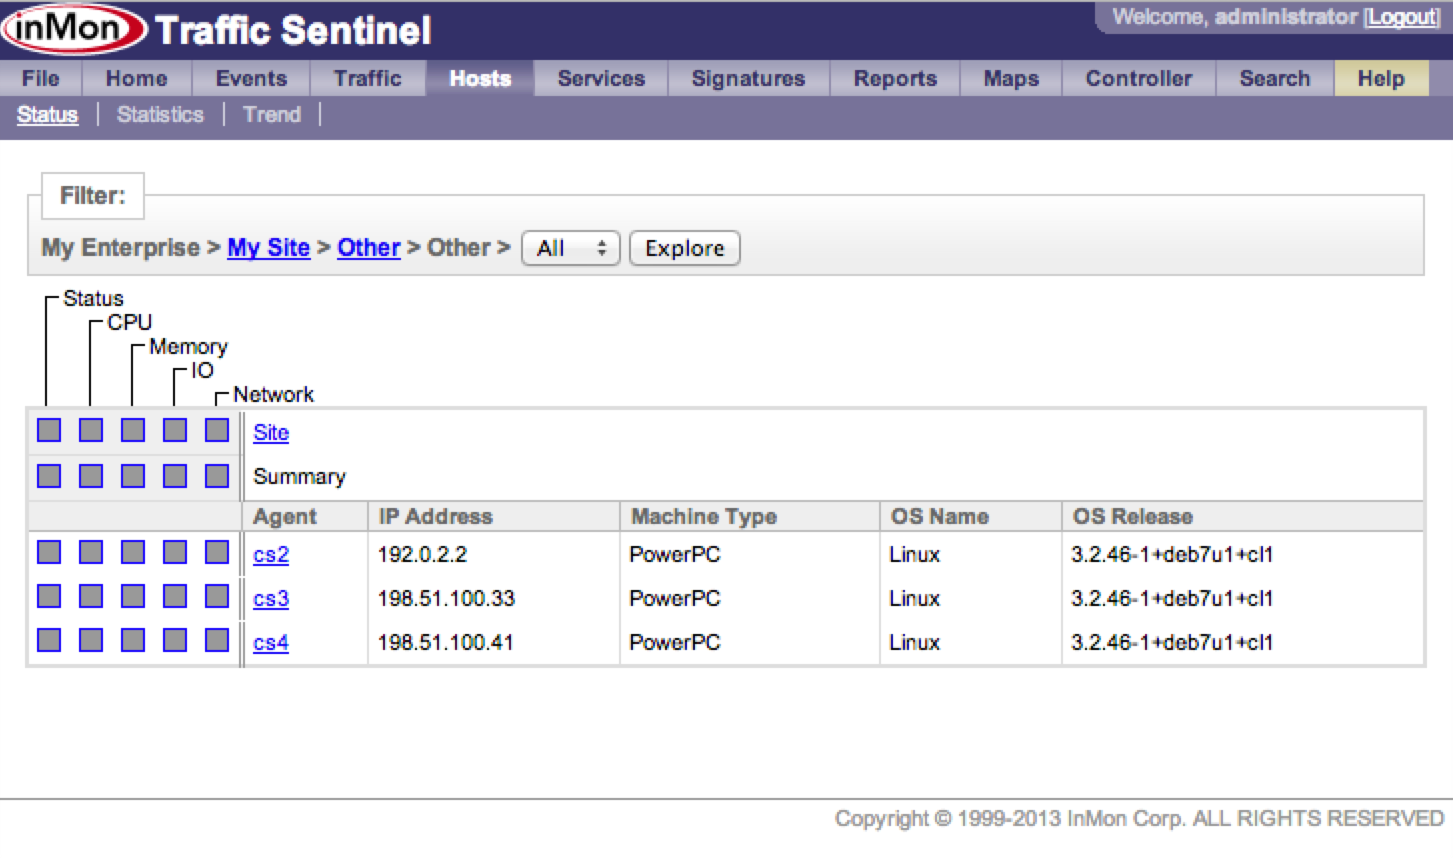
This image shows a list of all the available switches:
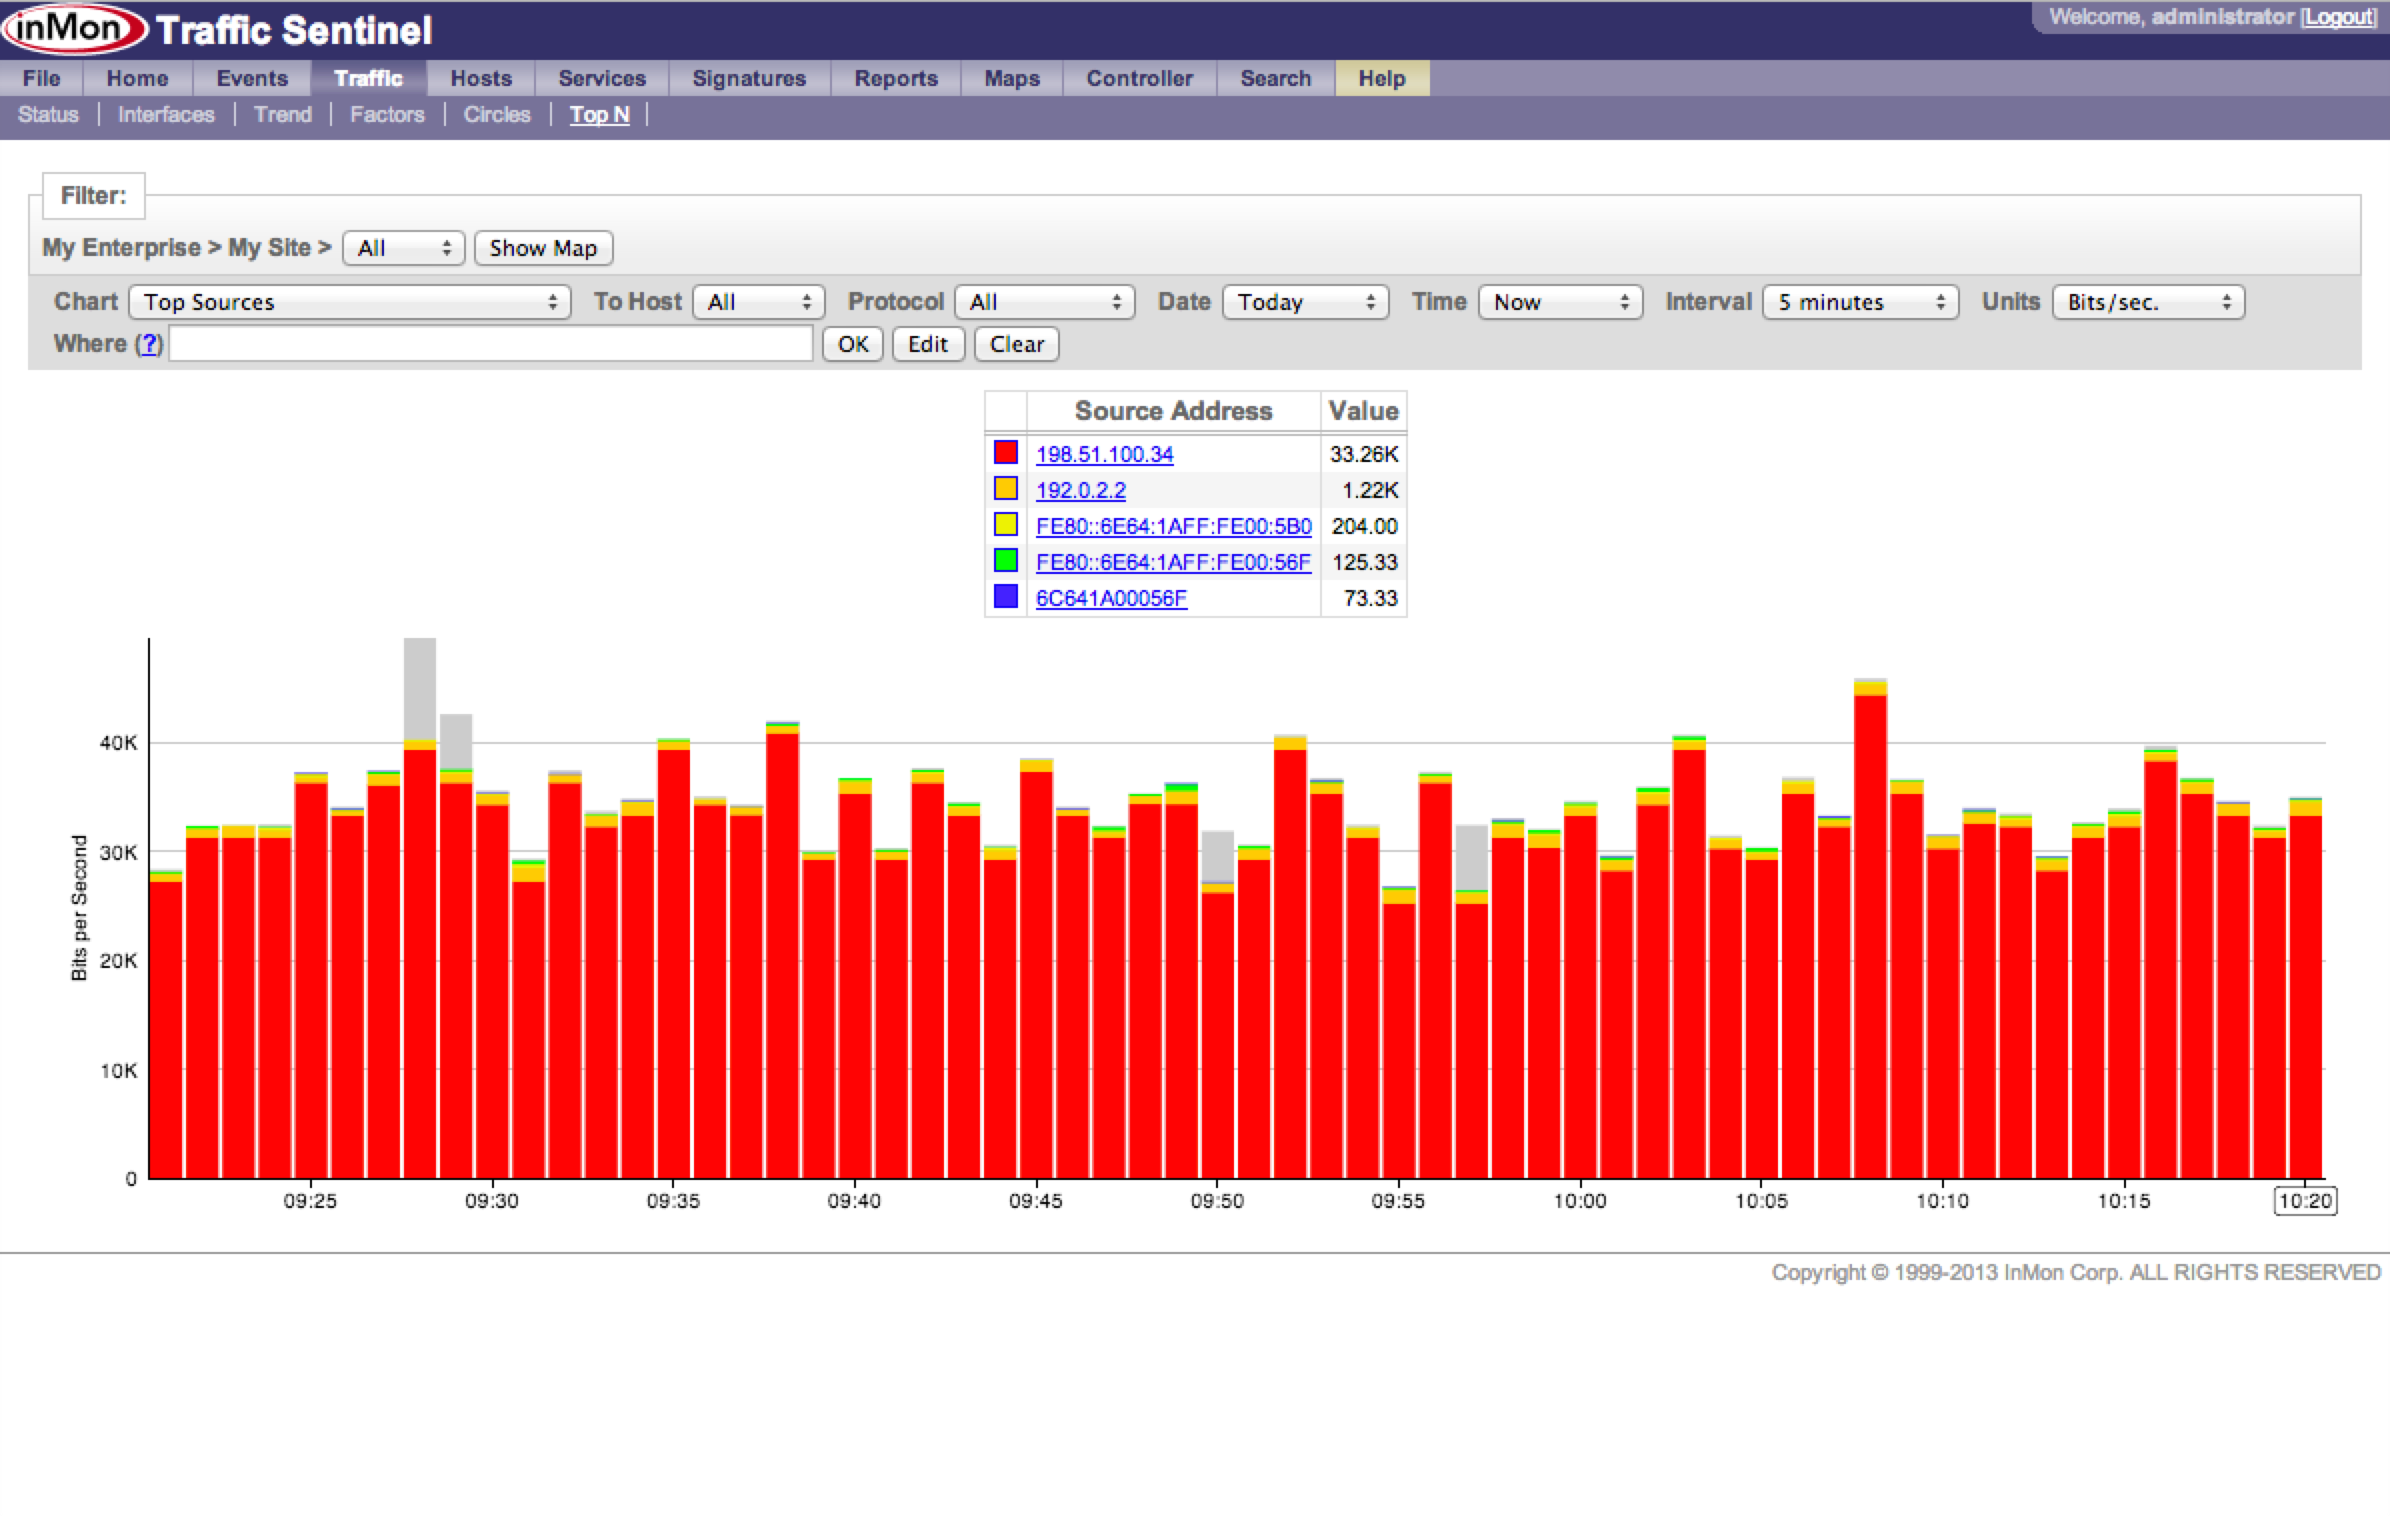
This image shows the top traffic flows for the switches you are monitoring:
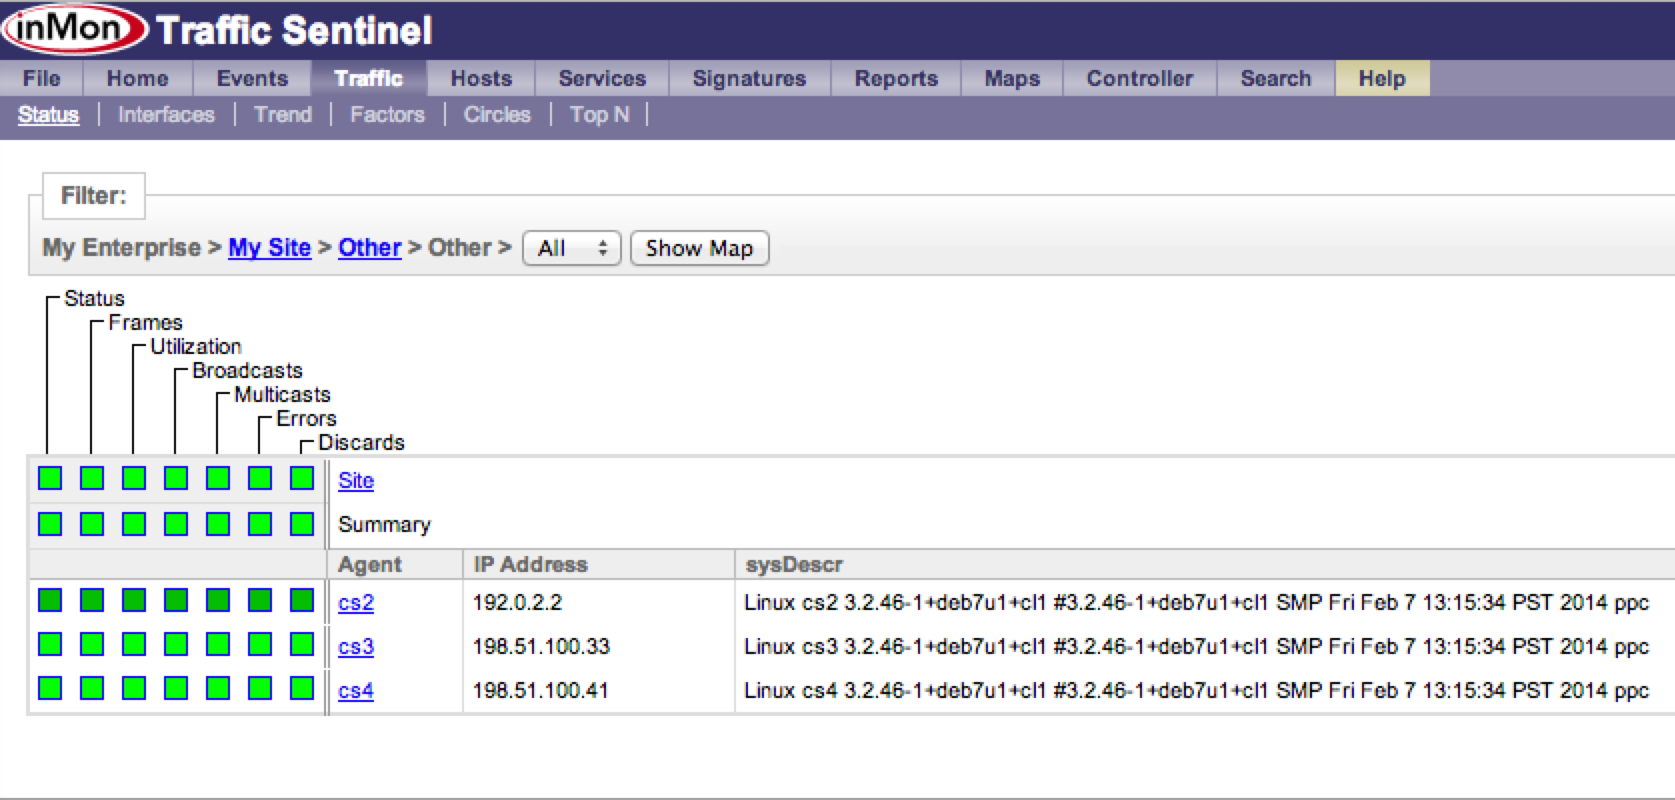
This image shows system status:
Learn More
The sFlow blog has excellent instructions on how to set up sFlow collectors; here are some more examples of configuring your collector: